The Somalia Consumer Price Index (CPI). Over the twelve months to September 2026, the CPI rose 6.8%. The most significant price rises over the twelve months were Recreation, Sport and Culture (+14.3%): reflecting higher costs for recreational services, cultural activities, and leisure-related expenditures.
During the month of September 2026, positive movements were recorded in.
The Somalia Consumer Price Index (CPI). Over the twelve months to August 2026, the CPI rose 6.9%. The most significant price rises over the twelve months were Restaurants and Accommodation Services (+16.5%): driven by Restaurant Services (+13.8%)
During the month of August 2026, there were no negative state‑level movements.
The annual Gross Domestic Product (GDP) statistics are key indicators of Somalia’s economy and its growth in recent years, providing estimates of expenditure levels and growth across the economy. Much effort has been made to secure new sources of data and improve the quality of data from existing sources. The estimates presented in this report were compiled as far as possible in accordance with the System of National Accounts, 2025 (2025 SNA).
The base year for Somalia’s National Accounts is 2022, largely based on consumption benchmarks derived from the 2022 Somalia Integrated Household Budget Survey. The National Accounts estimate in this report summarizes the latest economic developments and presents time series data from 2019 to 2025.
GDP Current Prices
Somalia’s economy continued to grow in 2025, with GDP at purchasers’ prices increasing from US$12.3 billion in 2024 to US$13.2 billion. Growth was supported by higher household consumption, government expenditure, and investment in fixed assets. Exports of goods and services also increased, contributing to overall economic activity. GDP per capita rose from US$761 to US$793, while GNI and GNDI reached US$13.5 billion and US$17.3 billion, respectively.
wdt_ID
Expenditure items
2019
2019
2020
2021
2022
2023
2024
2025
1
Household final consumption
10,558.07
10,827.28
11,539.37
12,683.40
14,115.81
15,210.44
16,307.09
2
Government final consumption
596.81
671.63
762.60
856.51
889.87
1,051.09
1,162.47
3
Gross fixed capital formation
1,391.69
1,380.72
1,705.35
2,412.56
2,576.22
2,677.61
2,960.34
4
Exports of goods and services
1,131.00
1,178.00
1,532.00
1,804.04
1,983.80
2,532.35
2,688.76
5
of which: livestock
406.20
402.18
523.35
558.38
860.87
950.93
922.91
6
Minus: Imports of goods and services
4,954.40
5,352.64
5,969.20
7,455.98
8,248.79
9,123.61
9,884.17
7
GDP at purchasers' prices
8,723.16
8,704.99
9,570.13
10,300.55
11,316.91
12,347.89
13,234.49
8
GDP per capita, US Dollars
616.89
598.84
640.42
670.52
716.62
760.61
793.02
9
Gross national expenditure
12,546.56
12,879.63
14,007.33
15,952.48
17,581.90
18,939.15
20,429.90
10
Gross national income
8,931.05
8,873.63
9,724.47
10,415.55
11,231.50
12,632.28
13,462.45
GDP Shares
Household final consumption remained the largest component of GDP by expenditure, accounting for over 123 percent of GDP in 2025. Gross fixed capital formation and exports represented 22.4 percent and 20.3 percent of GDP, respectively, reflecting continued investment and export activity. Imports amounted to 74.7 percent of GDP, while government final consumption accounted for 8.8 percent.
wdt_ID
Expenditure items
2019
2020
2021
2022
2023
2024
2025
1
Household final consumption
121.00
124.40
120.60
123.10
124.70
123.20
123.20
2
Government final consumption
6.80
7.70
8.00
8.30
7.90
8.50
8.80
3
Gross fixed capital formation
16.00
15.90
17.80
23.40
22.80
21.70
22.40
4
Exports of goods and services
13.00
13.50
16.00
17.50
17.50
20.50
20.30
5
of which: livestock
4.70
4.60
5.50
5.40
7.60
7.70
7.00
6
Minus: Imports of goods and services
56.80
61.50
62.40
72.40
72.90
73.90
74.70
7
GDP at purchasers' prices
100.00
100.00
100.00
100.00
100.00
100.00
100.00
GDP Growth Rate
Real GDP growth was estimated at 3.1 percent in 2025, following growth of 4.0 percent in 2024. Economic growth was supported by increases in household consumption, government expenditure, and gross fixed capital formation. Export growth moderated in 2025, while investment and domestic demand continued to contribute positively to economic activity.
wdt_ID
Expenditure items
2019
2020
2021
2022
2023
2024
2025
1
Household final consumption
0.7
-0.7
2.4
4.7
4.7
3.9
3.3
2
Government final consumption
4.4
11.3
12.4
11.9
2.8
16.0
9.2
3
Gross fixed capital formation
11.6
0.1
4.8
31.5
14.2
1.7
5.8
4
Exports of goods and services
-3.9
1.8
17.0
13.7
13.4
15.2
0.7
5
of which: livestock
26.9
-1.5
3.6
6.8
83.2
-10.3
-10.3
6
Minus: Imports of goods and services
-0.6
4.9
5.8
18.8
10.4
7.1
4.3
7
GDP at purchasers' prices
2.8
-2.7
3.5
2.8
4.2
4.0
3.1
GDP Real
Somalia’s GDP increased from US$11.2 billion in 2024 to US$11.5 billion in 2025, reflecting continued growth in real economic activity. Growth was supported by increases in household consumption, government expenditure, investment, and exports of goods and services. Gross national expenditure also rose to US$18.3 billion in 2025, indicating sustained domestic demand and economic expansion.
This publication provides Somalia’s Annual National Accounts for the year 2024, showing annual GDP estimates from expenditure approach at current and constant 2022 prices. All estimates are calculated in accordance with the System of National Accounts, 2008 which is a comprehensive, consistent and flexible set of macroeconomic accounts to meet the needs of policymakers, analysts and international observers.
The National Accounts provide comprehensive information on the income, spending and production that occurs in an economy. This information is broken down into various categories, allowing policy makers, analysts, and researchers to understand how different sectors are performing and how the economy grows over time. In essence, National Accounts are the foundation for analyzing and monitoring a country’s economic size, structure and dynamics, making them essential for informed decision-making.
Somalia Consumer Price Index (CPI) – Methodological Note Somalia National Bureau of Statistics (SNBS) May 2025
1. Introduction
The Somalia National Bureau of Statistics (SNBS), with technical support from the World Bank, has completed a comprehensive modernization of the Consumer Price Index (CPI) system. This reform represents a major step towards building a harmonized, nationally representative inflation measure, fully aligned with international standards.
Key innovations include:
Updating the weighting system using data from the Somalia Integrated Household Budget Survey (SIHBS) 2022;
Transitioning from COICOP 1999 to the latest COICOP 2018 classification.
Expanding geographic coverage to all Federal Member States (FMS) and Somaliland;
Strengthening institutional capacity at both national and state levels for data collection, validation, and publication.
This methodological note describes the changes introduced, the processes undertaken, and the implications for the newly released CPI.
2. Background
Prior to the modernization, CPI production in Somalia was fragmented and limited:
Separate CPIs were compiled for Banaadir, Puntland, and Somaliland using the COICOP 1999 classification systems, and weights drawn from the 2016 Somalia High Frequency Survey for Banaadir and Puntland, and the 2013 Household Income and Expenditure Survey (HIES) for Somaliland.
In the absence of a unified national CPI, the index for Mogadishu/Banaadir was used as a proxy for the entire country in policy and economic analysis.
Since January 2022, price data collection activities have been extended to all Federal Member States (FMS), with data collected primarily in the capital cities. In Puntland, collection is more extensive and also covers the cities of Bosaso and Galkayo, in addition to Garowe.
However, until the recent reform, these data were not integrated into the national CPI framework. Furthermore, there was no harmonization of the CPI basket structure across States, with varying levels of detail and item coverage. In terms of data collection methods, Puntland and Somaliland continued to use paper-based (PAPI) systems, while the remaining States employed tablet-based Computer-Assisted Personal Interviewing (CAPI) systems.
3. Transition to COICOP 2018
A central feature of the modernization process is the adoption of the Classification of Individual Consumption According to Purpose (COICOP) 2018, which replaces the previously used COICOP 1999 classification system. This transition introduces more detailed consumption categories, including the addition of a fourth level (subclass) that allows for more granular analysis. It also expands the number of divisions from twelve to thirteen by splitting Insurance and Financial Services and Personal Care and Miscellaneous Goods. Furthermore, the classification of goods and services has been improved, particularly in key sectors like health, communication, and recreation.
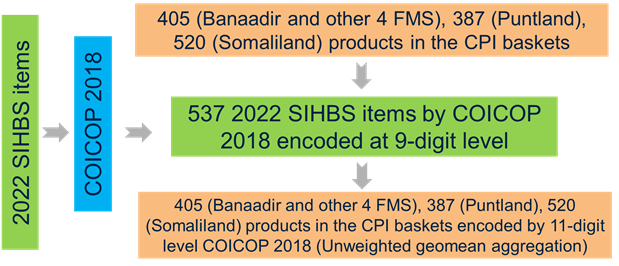
Implementing this transition required a comprehensive mapping process. A total of 537 items from the Somalia Integrated Household Budget Survey (SIHBS) were classified according to the 9-digit COICOP 2018 structure. Additionally, over 1,300 items in the CPI basket were realigned with the new COICOP codes. Throughout this process, special attention was paid to ensuring consistency across states, allowing the classification framework to fully support both state-level and national aggregation of the CPI.
4. Estimation of CPI Weights based on SIHBS 2022
The updated CPI weights are derived from the SIHBS 2022, the most comprehensive and recent source of household consumption data in Somalia. The survey covered more than 7,200 households across urban, rural, and nomadic areas in all Federal Member States and Somaliland, allowing for reliable state-specific and national expenditure estimates.
Given the heterogeneity of consumption patterns and potential survey reporting issues:
For food products, unit prices were calculated by combining quantity and expenditure data, with outlier detection based on the regional distribution of unit prices;
For non-food products, the analysis focused on the distribution of expenditure values across households;
Conversion to USD was applied using official exchange rates to standardize values across states.
Outliers were not excluded but adjusted by imputing regional median values, ensuring data robustness without discarding plausible household behaviours.
The estimation process for food expenditures relied on data regarding quantities consumed over the previous seven days, as well as information on purchases made within the last thirty days. When purchases had occurred within one week of the interview, expenditures were annualized under the assumption of stable weekly consumption patterns. For purchases made between eight and thirty days prior, the reported expenditures were appropriately scaled to estimate annual spending. In cases where purchase information was outdated or missing, estimations were derived using declared consumption quantities in combination with regional average prices. Overall, the process involved the treatment of about 150,000 individual records, resulting in a detailed and robust estimate of household food expenditures across the country.
For non-food items, the estimation process considered different recall periods, ranging from 7 days to 1 month, 6 months or 12 months, depending on the type of goods or services involved. Annual expenditures were calculated by applying the appropriate extrapolation factors to the reported figures. Durable goods, including vehicles and household appliances, were treated separately, with estimates based on information about asset ownership and acquisition provided by households. Additionally, education expenses, energy consumption, and transport services were carefully annualized using data collected through the specific modules of the SIHBS survey.
As regards imputed rents, the SIHBS questionnaire records actual rents for tenants, as well as self-reported imputed rent for owners and non-market tenants. However, 43.1% (2,265 out of 5,255) of households that report to be non-renters do not provide a self-reported estimated rent, and an additional 4.8% declare “0” as an estimate of rent. Therefore, the housing expenditure component of the consumption aggregate is constructed by annualizing actual rent and computing imputed rent for owners and non-market tenants, based on a hedonic regression model that accounted for key housing characteristics such as location, size, and available facilities.
Following the estimation of household expenditures, SIHBS items were classified according to COICOP 2018 at the 9-digit level (defined coherently with the 5-digit UNSD COICOP codes, six-digit for food items) providing a detailed and standardized framework for categorizing consumption. Each item in the CPI basket was then aligned with these classifications and assigned an 11-digit COICOP code to support accurate aggregation and reporting. In cases where a direct correspondence between SIHBS items and CPI basket entries was not available, the related expenditure shares were redistributed to appropriate higher-level categories within the COICOP structure—such as subclasses, classes, or divisions. This process ensured comprehensive coverage of household consumption in the CPI, even where limitations in the original survey design were present.
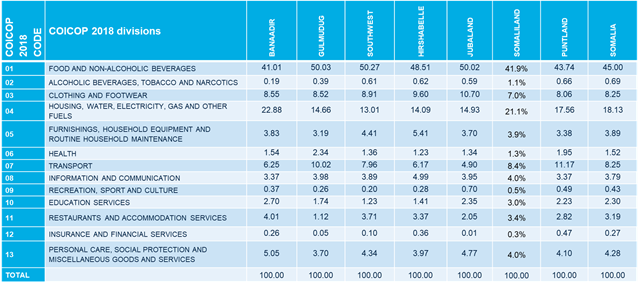
Table 1 reports the final set of CPI weights was normalized to sum to 100% and disaggregated by State (Banaadir, Puntland, Galmudug, Hirshabelle, Jubaland, South West, Somaliland) COICOP 2018 Division.
Table 1 Somalia CPI weights by COICOP 2018 division, including imputed rentals. 2022
Note: Somaliland temporarily paused the participation in the CPI innovation process due to local elections and change management in their statistics office
Table 1 shows that Food and Non-Alcoholic Beverages account for approximately 45 percent of total household expenditure at the national level, with variations ranging from 41 percent in Banaadir to over 50 percent in Hirshabelle and Jubaland.
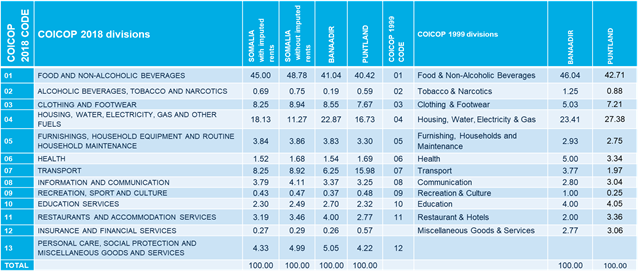
Table 2 presents a comparative overview of the structure of household consumption across two reference periods, highlighting the shift from the older COICOP 1999 classification used in 2016 to the updated COICOP 2018. It highlights significant increases in the relative importance of divisions such as Clothing and Footwear, Furnishings, and Transport compared to previous weighting structures. Moreover, the updated system includes new divisions such as Insurance and Financial Services, and Personal Care and Social Protection, reflecting broader and more modern consumption categories.
Table 2. Somalia CPI weights by COICOP 2018 and COICOP 1999 division. 2016 and 2022
5. Geographic Coverage
An essential achievement of the innovation project is the expansion of the CPI’s geographic coverage, with price data now being systematically collected across all Federal Member States and Somaliland. In most states, data collection activities are concentrated in the capital city, whereas in Puntland, the exercise extends to three cities—Garowe, Bosaso, and Galkayo—ensuring broader regional representation. Data collection is primarily conducted through Computer-Assisted Personal Interviewing (CAPI) technology, although in Puntland and Somaliland, paper-based methods (PAPI) are still in use, with plans underway to transition to CAPI.
To support the new structure, Data Delivery Agreements (DDAs) have been established between SNBS and the State statistical offices, clearly defining roles, responsibilities, and timelines. This expansion strengthens the ability of the national CPI to accurately capture and reflect the diverse economic conditions across Somalia.
6. Compilation Methodology
The CPI compilation follows a three-stage process:
Stage 1 – Calculation of elementary Price Indices
Elementary indices (at the 9-digit COICOP level) are calculated for each city/state using geometric means of monthly price relatives classified by 11-digit COICOP level codes.
Stage 2 – Aggregation at State and National Level
State-level indices are aggregated using the updated state-specific weights. In all the FMS (with the exception of Puntland), given that the data collection is carried out only in the capital city (that is assumed as representative of the entire State), the elementary aggregate price indices are considered as representative of the State. Only in Puntland, where price collection in carried out in three different cities, to arrive at State level elementary aggregate price indices, it is necessary to aggregate the indices calculated by using the prices collected in three towns (Bossaso, Galkayo, and Garowe): in this case the town level elementary aggregate indices are grouped by weighted arithmetic mean by using the population information as proxy.
National elementary indices are compiled through horizontal weighting, reflecting each State’s contribution to the national expenditure on each item.
Stage 3 – Vertical Aggregation
Higher-level indices (class, group, division) are compiled using Laspeyres-type formulas, respecting the COICOP 2018 hierarchy.
All indices are produced with a fixed base year (2022=100).
The annual Gross Domestic Product (GDP) statistics are key indicators of Somalia’s economy and its growth in recent years, providing estimates of expenditure levels and growth across the economy. Much effort has been made to secure new sources of data and improve the quality of data from existing sources, the estimates presented in this report were compiled to the best extent in accordance with the System of National Accounts, (SNA 2008). The 2008 SNA is the internationally agreed standard set of recommendations to compile measures of economic activity in accordance with strict accounting conventions based on economic principles. The accounting framework of the SNA allows economic data to be compiled and presented in a format that is designed for purposes of economic analysis, decision-making, policy formulation, and international comparisons using standard definitions and classifications.
The use of the expenditure approach in the constant 2022 prices dataset is one of the first steps towards transforming the data collected via the Somalia Integrated Household Budget Survey. The National Accounts estimate in this report summarizes the latest economic developments of 2023. This publication shows time series data of 2018-2023. The base year for the Somalia’s National Accounts have been updated from 2017 to 2022.
Somalia has in place the Ninth National Development Plan (NDP-9), which envisages a five year (2020-2024) pathway towards economic emancipation and reduction of poverty in the country, hence serves as an Interim Poverty Reduction Strategy Paper (IPRSP) within the framework of the Highly Indebted Poor Country (HIPC) initiative. Satisfactory implementation of the poverty reduction strategy will trigger the completion point of debt relief for Somalia.
Quality data and statistics are key for monitoring and evaluating the NDP-9, sectoral plans, the attainment of Sustainable Development Goals (SDGs) and measure the progress towards the completion point of debt relief.
This Poverty Analysis Report relies on the SIHBS—2022 data, whose report the SNBS published and disseminated on February 20, 2023, to analyze and measure current poverty levels and inequalities within Somalia by presenting valuable insights into the dimensions and distribution of poverty across regions and demographic groups.
The annual Gross Domestic Product (GDP) statistics are key indicators of Somalia’s economy and its growth in recent years, providing estimates of expenditure levels and growth across the economy. Much effort has been made to secure new sources of data and improve the quality of data from existing sources, the estimates presented in this report were compiled as far as possible in accordance with the System of National Accounts, (SNA 2008). The 2008 SNA is the internationally agreed standard set of recommendations to compile measures of economic activity in accordance with strict accounting conventions based on economic principles. The accounting framework of the SNA allows economic data to be compiled and presented in a format that is designed for purposes of economic analysis, decision-making, policy formulation, and international comparisons using standard definitions and classifications.
The use of the expenditure approach in the constant 2022 prices dataset is one of the first steps towards transforming the data collected via the Somalia Integrated Household Budget Survey. The national accounts estimate in this report summarize the latest economic developments of 2022. This publication shows time series data of 2016-2022. The base year for the Somalia’s national accounts have been updated from 2016 to 2022.
The All-Groups CPI was 141.08 in the month of April 2023, compared with 137.29 in the month of March 2023.
The rate of inflation for April 2023 is the percentage change in the Consumer Price Index (CPI) over the twelve-month period, from April 2022 to April 2023.
The annual Gross Domestic Product (GDP) statistics are key indicators of Somalia’s economy and its growth in recent years, providing estimates of expenditure levels and growth across the economy. While much effort has been made to secure new sources of data and improve the quality of data from existing sources, the estimates presented in this report were compiled as far as possible in accordance with the System of National Accounts, (SNA 2008).
Somalia’s real GDP increased by 2.9 percent in 2021 compared with a decrease of -0.3 percent in 2020. This reflects the Somalia’s partial emergence from the COVID-19 pandemic’s shock in 2020, with larger increases in per capita consumption of non-food products (relative to food) underpinning this result.